Viscoelastic Measures of Coagulation
➧ Viscoelastic measures of coagulation originated and developed in the 1940s.
➧ TEG was developed and first described by Dr. Hellmut Hartert at the University of Heidelberg (Germany) in 1948. The first reported clinical application of the test occurred during the Vietnam War in an attempt to guide transfusions of blood components in injured soldiers. In the 1980s, TEG was found to be beneficial in liver transplant patients, and in the 1990s, was demonstrated to be useful in cardiac surgery. Since then, TEG has evolved into a more commonly used test as more evidence for its clinical efficacy has been attained.
➧ Current technologies are Thromboelastography (TEG), Rotational Thromboelastometry (ROTEM), and Sonoclot, which allow for real-time in-vitro analysis of the kinetics of clot formation, clot strength, and fibrinolysis on whole blood samples.
A) Thromboelastography (TEG):
➧ TEG is a mechanism for assessing coagulation based on the viscoelastic properties of whole blood.
➧ In contrast to traditional, static measurements of hemostasis (PT, aPTT, INR, fibrinogen level, and fibrin degradation products), TEG allows for an assessment of near real-time, in-vivo clotting capacity, providing the interpreter information regarding the shear elasticity and the dynamics of clot development, strength, stability, and dissolution.
➧ TEG provides information about all components of hemostasis (coagulation, platelet function, fibrinolysis) but offers a particular advantage in diagnosing fibrinolysis.
➧ Graphic interpretation of TEG offers an assessment of coagulopathies (Thrombocytopenia, Factor deficiency, Heparin effect, Hypofibrinogenemia, and Hyperfibrinolysis).
➧ Example: Diagnosis of platelet dysfunction can be inferred by the findings of an abnormal thromboelastogram (in particular, a maximum amplitude < 45 mm) in combination with a normal platelet count and normal tests of coagulation.
Principle: (Figure 1)
 |
| Figure 1: Principle |
➧ To perform a TEG, a citrated sample of whole blood is placed into a heated sample cup with calcium chloride (to overcome the effects of the citrate), kaolin (a negatively charged molecule known to initiate the intrinsic pathway), and cephalins-phospholipids (required for optimal functioning of the extrinsic pathway).
➧ As the sample cup oscillates in a limited arc, the formation of clot results in the generation of rotational forces on a pin suspended from a torsion wire.
➧ Forces translated to the torsion wire are then transmitted to an electrical transducer and displayed on a computer screen, creating a characteristic waveform with numerical measurements of the kinetics of fibrin formation, fibrinolysis, and the strength of the resulting fibrin clot.
➧ Heparinase cups are commonly paired with plain cups to identify a heparin effect (h-TEG).
Rapid TEG (r-TEG):
➧ Rapid TEG (r-TEG) can be completed within 15 min. as compared to 30-45 min. for a standard TEG.
➧ In contrast to a TEG, whole blood samples for an r-TEG can be performed with citrated or non-citrated samples.
➧ Samples utilized for r-TEG are combined with celite (tissue factor activating the extrinsic pathway), and kaolin (activating the intrinsic pathway) +/- calcium chloride as applicable.
TEG Devices:
1-TEG 5000 (Thromboelastograph Hemostasis Analyzer): (Figure 2)
 |
| Figure 2: TEG 5000 |
2-TEG 6S (Haemonetics): (Figure 3)
 |
| Figure 3: TEG 6S |
➧ This new device no longer uses the ‘pin-in-cup’ technique, as did TEG 5000.
➧ It uses ‘Resonance’ where blood is exposed to a fixed vibration frequency range and the detector measures the vertical motion of blood meniscus under LED illumination and transforms that movement into tracing of clot dynamics. With pre-prepared cartridges, there is no longer any pipetting required.
B) Rotational thromboelastometry (ROTEM):
➧ Unlike traditional TEG, which utilizes a sample cup rotating in a limited arc, ROTEM employs a static sample cup with an oscillating pin/wire transduction system. (Figure 4)
 |
| Figure 4: TEG & ROTEM |
➧ ROTEM is a more complex diagnostic test than TEG, as it has four channels with different reagents to detect abnormalities in different components involved in coagulation:
1-INTEM: (Phospholipids) for Intrinsic pathway activation.
2-EXTEM: (Tissue factor for Extrinsic pathway activation.
3-HEPTEM: (Heparinase enz. + Phospholipids) for neutralization of heparin
4-FIBTEM: (Cytochalasin D) to inhibit platelet activity to differentiate between hypofibrinogenemia and platelet deficiency.
5-APTEM: (Aprotinin + Tissue factor) predicts the clinical effect of fibrinolysis inhibitors in case of hyperfibrinolysis.
6-NATEM: Native whole blood without reagent
➧ The values of analogous TEG and ROTEM parameters are not interchangeable but provide similar interpretations.
ROTEM Devices:
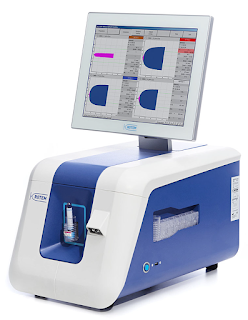
1-ROTEM Delta (ROTEM Whole Blood Haemostasis Analyser): (Figure 5)
 |
| Figure 5: ROTEM Delta |
2-ROTEM Sigma: (Figure 6)
 |
| Figure 6: ROTEM Sigma |
Uses:
➧ Viscoelastic point-of-care coagulation devices have been used in trauma and surgical settings to manage blood component transfusions in bleeding and/or coagulopathic patients.
➧ Rapid real-time bedside test with a simple methodology (point-of-care testing)
➧ Qualitative and quantitative assessment of the whole coagulation profile (Interpreted as normo-, hypo-, or hypercoagulable status)
➧ Global assessment of blood coagulability, including coagulation cascade, platelet function, and fibrinolysis
➧ Predict the clinical efficacy of therapeutic agents affecting blood coagulability
➧ Prediction of need for transfusion (maximum amplitude (MA) is a useful predictor in trauma)
➧ Guidance of blood product therapy, transfusion strategy, and decrease in the use of blood products.
➧ Cost-effectiveness and reduction in blood products in Liver transplantation and Cardiac surgery
➧ It May be useful in:
-Trauma (reduction in blood product use and mortality)
-Obstetrics (may decrease transfusion rates)
-Early detection of dilutional coagulopathy
➧ Difficult to interpret in certain situations:
-Low molecular weight heparin (LMWH)
-Warfarin
-Aspirin
-Post cardiac bypass
-Fibrinolysis
-Hypercoagulability
Graphical Presentation of TEG & ROTEM: (Figure 7)
 |
| Figure 7: Graphical Presentation of TEG & ROTEM |
Parameters of TEG & ROTEM: (Table 1)
➧ R (Reaction time, min.) or CT (Clotting Time, sec.): Is the time from initiation of the test until clot firmness reaches an amplitude of 2 mm, normal range of 5-7 min.
➧ K (Kinetic time, min.) or CFT (Clot Formation Time, sec.): Is a measure of time from the beginning of clot formation until the amplitude reaches 20 mm, and represents the dynamics of clot formation, normal range 1-3 min.
➧ α-angle (degree): This is an angle between the line in the middle of the TEG tracing and the line tangential to the developing “body” of the TEG tracing. The alpha angle represents the acceleration (kinetics) of fibrin build-up and cross-linking, normal range of 53-67 degrees.
➧ MA (Maximum Amplitude, mm) or MCF (Maximum Clot Firmness, mm): reflects the strength of the clot which is dependent on the number and function of platelets and its interaction with fibrin, with a normal range of 59-68 mm.
➧ CL30 or LY30 (%) (A30/MA*100): Clot lysis is measured as the decay in MA over 30 min., normal range of 0-8%.
➧ CL60 or LY60 (%) (A60/MA*100): Clot lysis is measured as the decay in MA over 60 min., normal range < 15%.
 |
| Table 1: TEG & ROTEM Parameters |
Calculated Parameters:
➧ EPL (Estimated Percent Lysis): EPL at 30 min. calculated continuously commencing 30 sec after determination of maximum amplitude. It is continuously calculated for 30 min. at which time EPL becomes Lysis 30 (LY30) as described above.
➧ CI (Coagulation Index): (CI = -0.2454R+ 0.0184K + 0.1655MA - 0.0241a - 5.0220), normal range +/- 3
➧ G (Shear Modulus Strength, dynes/cm²): Measures clot firmness, or strength [G=(5000*MA)/(100−MA)]. G values are higher in clots with more platelet-rich and which are held together by stronger fibrin matrices, normal range of 5.3-12.4 dynes/cm².
➧ E (Elasticity Constant, dynes/cm²): This is the normalized value of G; expressed as [(100*A)/(100−A)]. As a result, a normal maximum amplitude (MA) of 50 mm will yield an E value of 100. This parameter is calculated continuously.
➧ TPI (Thrombodynamic Potential Index): E obtained at maximum amplitude (MA) divided by K or EMX/K.
Examples: (Figure 8) & (Figure 9)
 |
| Figure 8: Example 1 |
 |
| Figure 9: Example 2 |
➧ Normal TEG
Case 2: (Figure 11)
Case 2: (Figure 11)
 |
| Figure 11: Case 2 |
Interpretation & Diagnosis:
➧ Short R (2 min.) and K (0.5 min.), large alpha angle (78 degrees) and MA (79.5 mm), no fibrinolysis:
-Hypercoagulable state.
Treatment:
➧ Depending on the clinical situation: may be treated with anticoagulant drug therapy.
Case 3: (Figure 12)
Case 3: (Figure 12)
 |
| Figure 12: Case 3 |
Interpretation & Diagnosis:
➧ Prolonged R (16.5 min.): Delayed clot formation; suspect:
-Heparin effect
-Factor deficiency
Treatment:
➧ Repeat TEG with Heparinase:
-If normal: administer protamine
-If abnormal: administer FFP
Case 4: (Figure 13)
Case 4: (Figure 13)
 |
| Figure 13: Case 4 |
Interpretation & Diagnosis:
➧ Small alpha angle (33 degrees) and MA (39 mm): Weak Clot Formation indicative of:
-Hypofibrinogemia and/or Thrombocytopenia/Poor platelet function.
Treatment:
➧ Requires administration of FFP, cryoprecipitate, and platelets.
➧ Adding ReoPro® (Abciximab) to the TEG sample will eliminate platelet function from the TEG tracing. The MA will become a function of fibrinogen activity.
➧ Low fibrinogen activity can be corrected by the administration of cryoprecipitate or FFP.
Case 5: (Figure 14)
Case 5: (Figure 14)
 |
| Figure 14: Case 5 |
Interpretation & Diagnosis:
➧ Short R (3 min.) MA borderline (49 mm), LY30 (11.5%):
➧ Poor platelet function and fibrinolysis
Treatment:
➧ Administer platelets and antifibrinolytics.
➧ The antifibrinolytics can be added to the TEG to pre-evaluate their effectiveness.
➧ Repeat the TEG post-treatment.
Case 6: (Figure 15)
Case 6: (Figure 15)
 |
| Figure 15: Case 6 |
Interpretation & Diagnosis:
➧ No clot formation; suspect:
➧ Very low clotting factors level
➧ Heparin effect
Treatment:
➧ Repeat TEG with Heparinase:
➧ If TEG normal: reverse heparin with protamine
➧ If TEG is abnormal: administer FFP
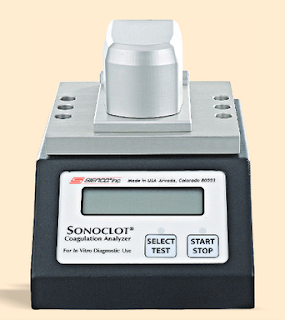
C) Sonoclot:
Principle: (Figure 16)
 |
| Figure 16: Sonoclot Principle |
➧ The Sonoclot analyzer has a hollow, open-ended disposable plastic probe, mounted on an ultrasonic transducer.
➧ The probe vibrates vertically at a distance of 1 µm at a frequency of 200 Hz and is immersed to a fixed depth in a cuvette containing a 0.4-ml sample of whole blood or plasma.
➧ The viscous drag is mechanically impeding the probe-free vibration.
➧ The drag increases as the sample clots and fibrin strands form on the probe tip, and between the probe and the wall of the cuvette, effectively increasing the mass of the probe.
 |
| Figure 17: Clot Signature |
➧ The increasing impedance to the vibration of the probe as the sample clots is detected by the electronic circuits driving the probe and converted to an output signal, on a paper chart recorder, which reflects the viscoelastic properties of the developing clot.
➧ The continuous output curve, or “Clot Signature” (Figure 17), describes the whole coagulation process in vitro, from the start of fibrin formation, through polymerization of the fibrin monomer, platelet interaction, and eventually to clot retraction and lysis.


