Educational Blog about Anesthesia, Intensive care and Pain management

Showing posts with label Monitoring. Show all posts

Jugular Venous Oximetry

Jugular Venous Oximetry (JVO)

-It provides insight into the metabolic and oxygenation state of the brain.

-It provides information about the balance of oxygen supply and demand, for a larger portion, if not the complete brain.

Indications:

-During cardiopulmonary bypass

-Neurosurgery

-After traumatic brain injury.

Jugular Venous Oximetry
Figure 1: JVO Catheterization Technique


Technique:

-A catheter is inserted into the jugular vein in a retrograde fashion (using Seldinger’s technique) so that its tip sits at the base of the skull in the jugular bulb. This allows continuous pressure monitoring as well as intermittent withdrawal of a jugular venous blood sample for gas analysis (Fig. 1).

-Continuous monitoring: This can be achieved using an oximetry catheter inserted via a conduit sheath.

-Confirmation of location: can be made with a lateral cervical spine x-ray (Fig. 2).

Jugular Venous Oximetry
Figure 2: JVO Catheter Lateral Cervical Spine X-Ray 


Identification of the dominant Jugular vein:

For the best representation of the metabolic state of the brain, the catheter should be placed in the dominant jugular vein, most commonly the right side. Confirmed by:

-In patients who have had a cerebral angiogram, the venous phase of the study will provide information on dominant venous drainage.

-The intra-arterial contrast will drain almost exclusively through one jugular vein, regardless of the side of injection.

-Side dominance can also be predicted using ultrasound where the dominant vein may be larger. In the absence of this information, the right side is preferred.

The pressure gradient between the jugular venous pressure and the central venous pressure:

-Pressure transduction of the jugular bulb catheter allows comparison with the central venous pressure to rule out potential venous obstruction.

-In a supine patient with a neutral neck position, there should be no pressure gradient between the tip of the jugular bulb and the central venous catheter.

-Although rare, a significant gradient (> 4 mmHg) can occasionally develop during positioning if there is significant twisting or bending of the neck.

-This gradient indicates venous obstruction, potentially causing brain edema or ischemia.

-The head should be repositioned until the gradient resolves.

Interpretation of blood gas analysis of jugular venous blood sample:

-The saturation of jugular venous blood (SjvO2) demonstrates whether cerebral blood flow (CBF) is sufficient to meet the cerebral metabolic rate for oxygen (CMRO2) of the brain (Lower values of SjvO2 reflecting greater uptake by the brain and therefore less blood flow).

-It is essential that blood samples from the retrograde catheter be drawn slowly to avoid contamination from non-cerebral venous blood.

-A normal value is between 65-75 %. Desaturation (SjvO2 < 55 %) indicates impending cerebral ischemia (e.g., caused by hypotension, hypocapnia, increasing cerebral edema).

-In traumatic brain injury, SjvO2 below 50% for more than 10 min. is undesirable and associated with poor outcomes. However, it has low sensitivity, (a relatively large volume of tissue must be affected, approximately 13 % before SjvO2 levels decreased below 50 %).

-Intraoperative hyperventilation will lower SjvO2 as it decreases CBF.

-In the setting of a non-traumatized brain that is exposed to moderate hyperventilation for the duration of a neurosurgical procedure, the acceptable level for SjvO2 is unknown.

-In the absence of other demands, it is reasonable to guide intraoperative hyperventilation by maintaining SjvO2 > 50%.

-Measurement of simultaneous arterial and jugular venous samples allows the determination of lactate output from the brain, the presence of which indicates the occurrence of anaerobic metabolism.

Disadvantages & Limitations:

-It is a global monitor that could easily miss small areas of regional ischemia.

-If CBF & O2 consumption both decreased (e.g., in severe brain injury, SjvO2 may be unchanged.

Minimally Invasive and Non-invasive Cardiac Output Monitoring

Minimally Invasive and Non-invasive Cardiac Output Monitoring

➧ The concept of determining blood flow/time Cardiac Output (CO) by measuring the dilution of a ‘known substance’ in the blood (Fick’s principle) has been applied by pulmonary artery (PA) catheter using the thermodilution technique remains the ‘Gold standard’ approach of CO monitoring. However, it is not without risk.

I. Esophageal Doppler U/S:

Principle: 

➧ It measures blood flow velocity in the descending thoracic aorta by using the change in frequency of the U/S beam as it reflects off a moving object (Doppler shift).

➧ If this measurement is combined with an estimate of the cross-sectional area of the aorta (derived value from pt. age, height & weight using nomograms), it allows hemodynamic variables to be calculated [Stroke Volume (SV), CO, Cardiac Index (CI)].

Advantage:

➧ Provides continuous measurements 

Limitations: 

➧ The following three conditions must be met to guarantee accuracy:

1-The cross-sectional area must be accurate. 

2-The US beam must be directed parallel to the flow of blood 

3-The beam direction cannot move to any great degree between measurements. 

➧ Variations in the above conditions lead to inaccuracies. 

Disadvantages: 

➧ The main problem with its use as a continuous CO monitor relates to its precision which indicates the reproducibility of a measurement. 

➧ It is operator-dependent and it is very easy for the position of the probe to change between measurements which will reduce the precision. 

➧ The need for frequent repositioning is not well tolerated by an awake pt. and is therefore need sedation.

II. Echocardiography: [Trans-Thoracic & Trans-Esophageal (TEE)]

Principle: 

➧ This technique can be used to calculate SV which can then be multiplied by HR to give the CO.

➧ For the assessment of SV; 2 steps are necessary:

1- Calculation of flow velocity from the area under the Doppler velocity wave. This represents the distance RBCs are projected forward in one cardiac cycle. 

2- Determination of area through which the flow is pushed forward (calculated from the diameter assuming a circular shape or determined by direct planimetry). Measurements can be performed at the level of [PA, Mitral Valve (MV), or Aortic Valve (AV)].

Advantage:

➧ Good correlation with thermodilution CO measurements providing that the MV is competent. 

Limitations: 

➧ It is very difficult to measure the diameter of PA. 

➧ Measurement at MV is even more difficult because the shape & size of the valve changes during the cardiac cycle 

➧ The AV is the third option for Doppler assessment which can be performed using transgastric or deep transgastric views. In the absence of aortic stenosis, this method is the most accurate for CO measurements. 

Disadvantages: 

➧ TEE cannot be tolerated by an awake patient as a continuous CO monitor. 

➧ Esophageal injury by the probe.

➧ Mediastinitis.

III. Thoracic Electrical Bioimpedance:

Principle: 

➧ Changes in thoracic volume cause changes in thoracic resistance (bioimpedance) to “low amplitude, high frequency” currents. If thoracic changes in bioimpedance are measured following ventricular depolarization, SV can be continuously determined. 

➧ Increasing fluid in the chest results in less electrical bioimpedance. 

➧ This noninvasive technique requires 6-electrodes to inject microcurrents & to sense bioimpedance on both sides of the chest. 

➧ Mathematical assumptions and correlations are then made to calculate CO from changes in bioimpedance. 

Advantage:

➧ Simple, quick, non-invasive with minimal pt. risk. 

Limitations:

➧ The accuracy is questionable in several groups of pt., e.g.; those with AV disease, previous heart surgery, or acute changes in thoracic sympathetic nervous function (e.g., those undergoing spinal a.). 

Disadvantages: 

➧ Electrode susceptibility to electrical interference. 

➧ Electrode placement is an important source of error. 

➧ Measurements influenced by intrathoracic fluid shifts and changes in Hct.

IV. Thoracic Bioreactance:

Principle: 

➧ Because of the limitations of bioimpedance devices, newer methods of processing the impedance signal have been developed. The most promising technology to reach the marketplace is the NICOM device (Cheetah Medical, Portland, OR), which measures the bioreactance or the phase shift in voltage across the thorax.

➧ The human thorax can be described as an electric circuit with a Resistor (R) and a capacitor (C), which together create the thoracic impedance (Zo).

➧ The values of R and C determine the two components of impedance, which are:

(1) Amplitude (a), the magnitude of the impedance (measured in ohms)

(2) Phase (phi), the direction of the impedance (measured in degrees)

➧ The pulsatile ejection of blood from the heart modifies the value of R and the value of C, leading to instantaneous changes in the amplitude and the phase of Zo. Phase shifts can occur only because of pulsatile flow. 

➧ The majority of thoracic pulsatile flow comes from the aorta. Therefore, the NICOM signal is correlated almost totally with the aortic flow. 

➧ Furthermore, because the underlying level of thoracic fluid is relatively static, neither the underlying levels of thoracic fluids nor their changes induce any phase shifts and do not contribute to the NICOM signal. 

➧ The NICOM monitor contains a highly sensitive phase detector that continuously captures thoracic phase shifts, which together result in the NICOM signal. 

➧ NICOM is totally non-invasive. This system consists of a high-frequency (75 kHz) Sine wave generator and 4-dual electrode “stickers” that are used to establish electric contact with the body. 

➧ Each sticker has two electrodes, one electrode is used by the high-frequency current generator to inject the high-frequency sine wave into the body, whereas the other electrode is used by the voltage input amplifier. 

➧ Two stickers are placed on the right side of the body, and two stickers are placed on the left side of the body. The stickers on a given side of the body are paired, so the currents are passed between the outer electrodes of the pair, and voltages are recorded from between the inner electrodes. 

➧ Thus, a non-invasive CO measurement signal is determined separately from each side of the body, and the final noninvasive CO measurement signal is obtained by averaging these two signals. 

➧ The system’s signal processing unit determines the relative phase shift (∆ɸ) between the input and output signals. The peak rate of change of ɸ (dɸ/dtmax) is proportional to the peak aortic flow during each beat. 

➧ The SV is calculated from the following formula: SV = C × VET × dɸ/dtmax, where C is a constant of proportionality and Ventricular Ejection Time (VET) is determined from the NICOM and electrocardiographic signals. 

Advantage: 

➧ Totally non-invasive. 

➧ Unlike bioimpedance, bioreactance-based CO measurements do not use the static impedance (Zo) and do not depend on the distance between the electrodes for the calculations of SV, both factors that reduce the reliability of the result. 

➧ NICOM averages the signal over 1 minute, therefore allowing “accurate” determination of CO in patients with atrial and ventricular arrhythmias. 

➧ NICOM assessment of the CO can be performed in ventilated and non-ventilated patients alike. 

➧ It is very easy to set up with a high degree of acceptability by nursing staff. 

➧ NICOM assessment of the CO can be performed in the emergency room, intensive care unit, and operating room. 

Limitations & Disadvantages: 

➧ Electrocautery interferes with the NICOM signal. However, as long as the device receives a single for at least 20 sec. within a minute, the CO can be determined. When electrocautery is on for more than 40 sec. in a given minute, the CO for that minute is not displayed.

V. Lithium Dilution CO (LiDCO):

Principle: 

➧ Depends on the “indicator dilution technique” which is minimally invasive, requiring only venous (central or peripheral) & arterial lines. 

➧ The indicator is isotonic lithium chloride (LiCl) which is injected as a very small bolus (0.3 mmol) via the venous line. LiCl is not normally present in the plasma & not metabolized, and is excreted almost entirely in the urine. 

➧ LiCl sensitive sensor, attached to the peripheral arterial line, detects the concentration of LiCl ions in the arterial blood. 

➧ The LiCl indicator dilution “wash-out” curve provides an accurate absolute CO value. 

Advantage: 

➧ Simple and Minimally invasive, 

➧ As accurate as, or more accurate than bolus thermodilution. 

➧ Safe and does not elicit any hemodynamic changes that are sometimes seen with injections of cold saline. 

Limitations & Disadvantages: 

➧ The clinical margin of safety: Although the amount of LiCl injected is 100 lower than the lowest clinical doses of ‘lithium-treated patients’, it is recommended to administer not more than 10-20 boluses of lithium. 

➧ Side-effects of multiple injections over a short time need to be investigated.

VI. Pulse Pressure Analysis Techniques: (Pulse Contour Analysis Devices)

Principle: 

➧ Utilize the arterial pressure tracing curve to estimate the CO and other dynamic parameters; [SV, Systemic Vascular Resistance (SVR), and Blood Pressure (BP)]. 

➧ It measures the area of the systolic portion of the arterial pressure trace from end-diastole to the end of ventricular ejection, together with an individual calibration factor to account for individual vascular compliance. 

➧ Some devices use thermo- or Li-dilution for calibration for subsequent measurement. 

➧ Some devices (“FloTrac”; Edwards Life Sciences) do not require calibration with another measure and rely upon statistical analysis and algorithm. 

Advantage: 

➧ Offers ‘beat-to-beat’ Continuous, non-invasive CO measurement. 

➧ Reliable, accurate, precise, and comparable to PA-thermodilution. 

➧ Frequent recalibration or even no-calibration (“FloTrac”) is not required. 

Limitations & Disadvantages:

➧ Cost.

Viscoelastic Measures of Coagulation

Viscoelastic Measures of Coagulation


Viscoelastic Measures of Coagulation

Introduction:


➧ Viscoelastic measures of coagulation originated and developed in the 1940s.

➧ TEG was developed and first described by Dr. Hellmut Hartert at the University of Heidelberg (Germany) in 1948. The first reported clinical application of the test occurred during the Vietnam War in an attempt to guide transfusions of blood components in injured soldiers. In the 1980s, TEG was found to be beneficial in liver transplant patients, and in the 1990s, was demonstrated to be useful in cardiac surgery. Since then, TEG has evolved into a more commonly used test as more evidence for its clinical efficacy has been attained.

➧ Current technologies are Thromboelastography (TEG), Rotational Thromboelastometry (ROTEM), and Sonoclot, which allow for real-time in-vitro analysis of the kinetics of clot formation, clot strength, and fibrinolysis on whole blood samples.

A) Thromboelastography (TEG):


➧ TEG is a mechanism for assessing coagulation based on the viscoelastic properties of whole blood.

➧ In contrast to traditional, static measurements of hemostasis (PT, aPTT, INR, fibrinogen level, and fibrin degradation products), TEG allows for an assessment of near real-time, in-vivo clotting capacity, providing the interpreter information regarding the shear elasticity and the dynamics of clot development, strength, stability, and dissolution.

➧ TEG provides information about all components of hemostasis (coagulation, platelet function, fibrinolysis) but offers a particular advantage in diagnosing fibrinolysis.

➧ Graphic interpretation of TEG offers an assessment of coagulopathies (Thrombocytopenia, Factor deficiency, Heparin effect, Hypofibrinogenemia, and Hyperfibrinolysis).

➧ Example: Diagnosis of platelet dysfunction can be inferred by the findings of an abnormal thromboelastogram (in particular, a maximum amplitude < 45 mm) in combination with a normal platelet count and normal tests of coagulation.

Principle: (Figure 1)

Figure 1: Principle
➧ To perform a TEG, a citrated sample of whole blood is placed into a heated sample cup with calcium chloride (to overcome the effects of the citrate), kaolin (a negatively charged molecule known to initiate the intrinsic pathway), and cephalins-phospholipids (required for optimal functioning of the extrinsic pathway).

➧ As the sample cup oscillates in a limited arc, the formation of clot results in the generation of rotational forces on a pin suspended from a torsion wire.

➧ Forces translated to the torsion wire are then transmitted to an electrical transducer and displayed on a computer screen, creating a characteristic waveform with numerical measurements of the kinetics of fibrin formation, fibrinolysis, and the strength of the resulting fibrin clot.

➧ Heparinase cups are commonly paired with plain cups to identify a heparin effect (h-TEG).

Rapid TEG (r-TEG):


➧ Rapid TEG (r-TEG) can be completed within 15 min. as compared to 30-45 min. for a standard TEG.

➧ In contrast to a TEG, whole blood samples for an r-TEG can be performed with citrated or non-citrated samples.

➧ Samples utilized for r-TEG are combined with celite (tissue factor activating the extrinsic pathway), and kaolin (activating the intrinsic pathway) +/- calcium chloride as applicable.

TEG Devices:


1-TEG 5000 (Thromboelastograph Hemostasis Analyzer): (Figure 2)
TEG 5000
Figure 2: TEG 5000
2-TEG 6S (Haemonetics): (Figure 3)
TEG 6S
Figure 3: TEG 6S
➧ This new device no longer uses the ‘pin-in-cup’ technique, as did TEG 5000.

➧ It uses ‘Resonance’ where blood is exposed to a fixed vibration frequency range and the detector measures the vertical motion of blood meniscus under LED illumination and transforms that movement into tracing of clot dynamics. With pre-prepared cartridges, there is no longer any pipetting required.

B) Rotational thromboelastometry (ROTEM):


➧ Unlike traditional TEG, which utilizes a sample cup rotating in a limited arc, ROTEM employs a static sample cup with an oscillating pin/wire transduction system. (Figure 4)

TEG & ROTEM
Figure 4: TEG & ROTEM
➧ ROTEM is a more complex diagnostic test than TEG, as it has four channels with different reagents to detect abnormalities in different components involved in coagulation:

1-INTEM: (Phospholipids) for Intrinsic pathway activation.

2-EXTEM: (Tissue factor for Extrinsic pathway activation.

3-HEPTEM: (Heparinase enz. + Phospholipids) for neutralization of heparin

4-FIBTEM: (Cytochalasin D) to inhibit platelet activity to differentiate between hypofibrinogenemia and platelet deficiency.

5-APTEM: (Aprotinin + Tissue factor) predicts the clinical effect of fibrinolysis inhibitors in case of hyperfibrinolysis.

6-NATEM: Native whole blood without reagent

➧ The values of analogous TEG and ROTEM parameters are not interchangeable but provide similar interpretations.

ROTEM Devices:


1-ROTEM Delta (ROTEM Whole Blood Haemostasis Analyser): (Figure 5)
ROTEM Delta
Figure 5: ROTEM Delta
2-ROTEM Sigma: (Figure 6)
ROTEM Sigma
Figure 6: ROTEM Sigma

Uses:


➧ Viscoelastic point-of-care coagulation devices have been used in trauma and surgical settings to manage blood component transfusions in bleeding and/or coagulopathic patients.

➧ Rapid real-time bedside test with a simple methodology (point-of-care testing)

➧ Qualitative and quantitative assessment of the whole coagulation profile (Interpreted as normo-, hypo-, or hypercoagulable status)

➧ Global assessment of blood coagulability, including coagulation cascade, platelet function, and fibrinolysis

➧ Predict the clinical efficacy of therapeutic agents affecting blood coagulability

➧ Prediction of need for transfusion (maximum amplitude (MA) is a useful predictor in trauma)

➧ Guidance of blood product therapy, transfusion strategy, and decrease in the use of blood products.

➧ Cost-effectiveness and reduction in blood products in Liver transplantation and Cardiac surgery

➧ It May be useful in:

-Trauma (reduction in blood product use and mortality)

-Obstetrics (may decrease transfusion rates)

-Early detection of dilutional coagulopathy

Difficult to interpret in certain situations:

-Low molecular weight heparin (LMWH)

-Warfarin

-Aspirin

-Post cardiac bypass

-Fibrinolysis

-Hypercoagulability

Graphical Presentation of TEG & ROTEM: (Figure 7)

Graphical Presentation of TEG & ROTEM
Figure 7: Graphical Presentation of TEG & ROTEM

Parameters of TEG & ROTEM: (Table 1)


R (Reaction time, min.) or CT (Clotting Time, sec.): Is the time from initiation of the test until clot firmness reaches an amplitude of 2 mm, normal range of 5-7 min.

K (Kinetic time, min.) or CFT (Clot Formation Time, sec.): Is a measure of time from the beginning of clot formation until the amplitude reaches 20 mm, and represents the dynamics of clot formation, normal range 1-3 min.

α-angle (degree): This is an angle between the line in the middle of the TEG tracing and the line tangential to the developing “body” of the TEG tracing. The alpha angle represents the acceleration (kinetics) of fibrin build-up and cross-linking, normal range of 53-67 degrees.

MA (Maximum Amplitude, mm) or MCF (Maximum Clot Firmness, mm): reflects the strength of the clot which is dependent on the number and function of platelets and its interaction with fibrin, with a normal range of 59-68 mm.

CL30 or LY30 (%) (A30/MA*100): Clot lysis is measured as the decay in MA over 30 min., normal range of 0-8%.

CL60 or LY60 (%) (A60/MA*100): Clot lysis is measured as the decay in MA over 60 min., normal range < 15%.

TEG & ROTEM Parameters
Table 1: TEG & ROTEM Parameters

Calculated Parameters:


➧ EPL (Estimated Percent Lysis): EPL at 30 min. calculated continuously commencing 30 sec after determination of maximum amplitude. It is continuously calculated for 30 min. at which time EPL becomes Lysis 30 (LY30) as described above.

➧ CI (Coagulation Index): (CI = -0.2454R+ 0.0184K + 0.1655MA - 0.0241a - 5.0220), normal range +/- 3

➧ G (Shear Modulus Strength, dynes/cm²): Measures clot firmness, or strength [G=(5000*MA)/(100−MA)]. G values are higher in clots with more platelet-rich and which are held together by stronger fibrin matrices, normal range of 5.3-12.4 dynes/cm².

E (Elasticity Constant, dynes/cm²): This is the normalized value of G; expressed as [(100*A)/(100−A)]. As a result, a normal maximum amplitude (MA) of 50 mm will yield an E value of 100. This parameter is calculated continuously.

TPI (Thrombodynamic Potential Index): E obtained at maximum amplitude (MA) divided by K or EMX/K.

Examples: (Figure 8) & (Figure 9)

Viscoelastic Measures of Coagulation
Figure 8: Example 1
Viscoelastic Measures of Coagulation
Figure 9: Example 2
Case 1: (Figure 10)
Viscoelastic Measures of Coagulation
Figure 10: Case 1
Interpretation & Diagnosis:

➧ Normal TEG

Case 2: (Figure 11)
Viscoelastic Measures of Coagulation
Figure 11: Case 2
Interpretation & Diagnosis:

➧ Short R (2 min.) and K (0.5 min.), large alpha angle (78 degrees) and MA (79.5 mm), no fibrinolysis:

-Hypercoagulable state.

Treatment:

➧ Depending on the clinical situation: may be treated with anticoagulant drug therapy.

Case 3: (Figure 12)
Viscoelastic Measures of Coagulation
Figure 12: Case 3
Interpretation & Diagnosis:

➧ Prolonged R (16.5 min.): Delayed clot formation; suspect:

-Heparin effect

-Factor deficiency

Treatment:

➧ Repeat TEG with Heparinase:

-If normal: administer protamine

-If abnormal: administer FFP

Case 4: (Figure 13)
Viscoelastic Measures of Coagulation
Figure 13: Case 4
Interpretation & Diagnosis:

➧ Small alpha angle (33 degrees) and MA (39 mm): Weak Clot Formation indicative of:

-Hypofibrinogemia and/or Thrombocytopenia/Poor platelet function.

Treatment:

➧ Requires administration of FFP, cryoprecipitate, and platelets.

➧ Adding ReoPro® (Abciximab) to the TEG sample will eliminate platelet function from the TEG tracing. The MA will become a function of fibrinogen activity.

➧ Low fibrinogen activity can be corrected by the administration of cryoprecipitate or FFP.

Case 5: (Figure 14)
Viscoelastic Measures of Coagulation
Figure 14: Case 5
Interpretation & Diagnosis:

➧ Short R (3 min.) MA borderline (49 mm), LY30 (11.5%):

➧ Poor platelet function and fibrinolysis

Treatment:

➧ Administer platelets and antifibrinolytics.

➧ The antifibrinolytics can be added to the TEG to pre-evaluate their effectiveness.

➧ Repeat the TEG post-treatment.

Case 6: (Figure 15)
Viscoelastic Measures of Coagulation
Figure 15: Case 6
Interpretation & Diagnosis:

➧ No clot formation; suspect:

➧ Very low clotting factors level

➧ Heparin effect

Treatment:

➧ Repeat TEG with Heparinase:

➧ If TEG normal: reverse heparin with protamine

➧ If TEG is abnormal: administer FFP

C) Sonoclot:


Principle: (Figure 16)


Sonoclot Principle
Figure 16: Sonoclot Principle
➧ The Sonoclot analyzer has a hollow, open-ended disposable plastic probe, mounted on an ultrasonic transducer.

➧ The probe vibrates vertically at a distance of 1 µm at a frequency of 200 Hz and is immersed to a fixed depth in a cuvette containing a 0.4-ml sample of whole blood or plasma.

➧ The viscous drag is mechanically impeding the probe-free vibration.

➧ The drag increases as the sample clots and fibrin strands form on the probe tip, and between the probe and the wall of the cuvette, effectively increasing the mass of the probe.

Clot Signature
Figure 17: Clot Signature
➧ The increasing impedance to the vibration of the probe as the sample clots is detected by the electronic circuits driving the probe and converted to an output signal, on a paper chart recorder, which reflects the viscoelastic properties of the developing clot.

➧ The continuous output curve, or “Clot Signature” (Figure 17), describes the whole coagulation process in vitro, from the start of fibrin formation, through polymerization of the fibrin monomer, platelet interaction, and eventually to clot retraction and lysis.

Sonoclot Device: (Figure 18)
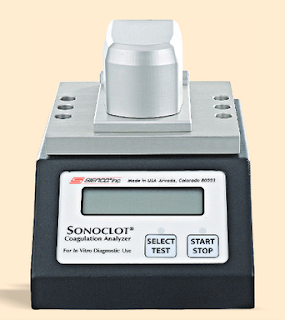
Sonoclot Analyser
Figure 18: Sonoclot Analyser

INVOS™: In Vivo Optical Spectroscopy

INVOS™: In Vivo Optical Spectroscopy


Overview:

➧ INVOS™ system technology gives a noninvasive “window” to the body’s microvasculature; a direct and dynamic site of gas exchange that transports about half the body’s blood volume. 

➧ Measuring blood oxygenation in the microvasculature results in sensitive and site-specific insights on perfusion adequacy and multi-sensor monitoring gives data about perfusion distribution across the brain and body. 

➧ The non-invasive INVOS System reports the venous-weighted regional hemoglobin oxygen saturation (rSO₂) in the tissue under the sensor; reflecting the Hb bound O₂ remaining after tissues have taken what they need. Decreases in this venous reserve indicate increased ischemic risk and compromised tissue perfusion.

Clinical applications:

-Cerebral application: Brain area measurement

-Somatic application: Tissue area of measurement

Principle:

➧ The INVOS™ system utilizes near-infrared light at wavelengths that are absorbed by hemoglobin (730 and 810 nm). Light travels from the sensor’s light-emitting diode to either a proximal or distal detector, permitting separate data processing of shallow and deep optical signals.

➧ INVOS™ system’s ability to localize the area of measurement, called the spatial resolution, has been empirically validated in human subjects.

➧ Data from the scalp and surface tissue are subtracted and suppressed, reflecting rSO₂ in deeper tissues. This same concept applies to somatic monitoring.

➧ The result is continuous, real-time adequacy of perfusion data in up to four sites of your choice.

Clinical characteristics:

1-Noninvasive 

2-Continuous, real-time

3-Capillary (Venous and Arterial) sample

4-Measures the balance between O₂ supply and demand beneath the sensor

5-End organ oxygenation and perfusion

6-Requires neither pulsatility nor blood flow

Interpretation Values:

1-Cerebral: High blood flow, High O₂ extraction: 

➧ Typical rSO₂ range: 60-80%; assuming SpO₂ is > 90%.

➧ Common intervention trigger: rSO₂ < 50% or 20% change from rSO₂ baseline.

➧ Critical threshold: rSO₂ < 45% or 25% change from rSO₂ baseline.

2-Somatic: Variable blood flow, Lower O₂ extraction:

➧ Variances in the cerebral-somatic relationship may be indicative of pathology. 

➧ Watch for drops of 20% below patient baseline.